EPIC™ is a powerful cloud-based app that enables energy efficiency professionals to estimate energy savings, emissions reduction, and financial impacts of their energy improvement projects in real time with minimal data inputs. EPIC predictive analytics are powered by data collected by Sustainable Real Estate Solutions, Inc. (SRS) over the past decade in the performance of thousands of energy improvement project technical and financial analyses. EPIC’s algorithms are augmented by utility energy efficiency program technical resource manuals, equipment manufacturers’ data, and industry best practice energy savings calculation methodologies.


EPIC App FAQs
What is EPIC™?
What web browsers and operating systems are supported by EPIC?
For the best EPIC experience we recommend using the latest version of Google Chrome on a desktop or laptop computer.
The following operating systems are also supported by EPIC:
- Windows 10: Chrome and the most recent version of Microsoft Edge (version 79 or greater)
- Mac OS: both Safari and Chrome
- iPad tablet: both Safari and Chrome (EPIC is optimized for landscape mode)
- Android tablet: latest version of Android 9+ with Chrome (EPIC is optimized for landscape mode)
We recommend using the latest browser version available to your operating system. See your browser’s documentation to learn more about checking and updating your version:
How is a property's year of construction used by EPIC?
The property’s year of construction is used by EPIC to estimate the baseline energy efficiency of existing equipment, as follows:
- Building >25 years old: If the age of existing equipment is unknown all existing heating and cooling equipment is assumed to be 25 years old for purposes of establishing the building’s baseline energy efficiency metrics, e.g., EER, combustion efficiency, etc., for existing equipment.
- Building <25 years old: If the age of existing equipment is unknown all existing heating and cooling equipment is assumed to be equivalent to the age of the building for purposes of establishing the building’s baseline energy efficiency, e.g., EER, combustion efficiency, etc. for existing equipment.
Upon determination of existing equipment age, EPIC assumes the applicable energy efficiency metric(s), e.g., EER, combustion efficiency, etc., are consistent with the ASHRAE 90.1 standard in effect at the time existing equipment was installed. In the event there was a time lag between the ASHRAE 90.1 standard in effect at the time of equipment installation and when the local building energy code was updated to reflect such standard, EPIC enables the user to edit their project’s equipment baseline energy efficiency metric(s).
If the property owner is unable to provide the building’s year of construction, typically a web search of the property’s address will identify public (e.g., property tax assessor) and private (e.g., LoopNet, Property Shark, etc.) sources that contain property year built information.
How do I calculate the gross floor area of a building?
The gross floor area (GFA) of a building (whether leased or owner occupied) is equal to the square footage of all floor levels as measured from the outside surface of the exterior walls, with no deduction for hallways, stairs, closets, columns or other interior features, excluding parking area. The GFA is distinguished from the gross rentable or leasable area in tenant-occupied buildings which excludes common areas.
If the property owner is unable to provide the building’s GFA, typically a web search of the property’s address will identify public (e.g., property tax assessor) and private (e.g., LoopNet, Property Shark, etc.) sources that contain building square footage data.
What is the principal property type?
EPIC assumes the principal property type is defined by that use which occupies at least 75% of the gross floor area (GFA). In mixed-use properties the user can select the property type which occupies at least 75% of the GFA or select “mixed-use” when adding a scenario to estimate the key performance indicators for each use type. See the “What is a mixed-use building” FAQ to learn more about EPIC’s mixed-use feature.
Don’t see your property type in the list? Click here to lookup your property type match.
What is a mixed-use building?
Mixed-use buildings combine multiple use types into a single building, e.g., ground floor retail and upper floor office space. When a building’s primary use type occupies at least 75% of the gross floor area (GFA), consistent with EPA ENERGY STAR Portfolio Manager’s methodology, EPIC assumes the whole building’s use as this primary use type. As such, if 75% of the building GFA is office space and 25% retail space, EPIC assumes the whole building’s use type as office.
This “Single-use” assumption typically works well when the energy use intensity (EUI) of the secondary use type(s) is consistent with that of the primary use. However, in cases where the secondary use(s) EUI is inconsistent with the primary use EUI, error can be introduced in the energy savings calculations.
For example, consider a four-story mixed-use building with 25,000 sq. ft. of ground floor retail space with an EUI of 150 kBtu/SF-yr and 3 floors, 75,000 sq. ft. of office use with an EUI of 65 kBtu/SF-yr. If the entire building is assumed to be a single-use office, then the building’s EUI would be 65 kBtu/SF-yr. However, if the building is assumed to be mixed-use retail (25,000 sq. ft.) and office (75,000 sq. ft.), then the whole building EUI would be approximately 87 kBtu/SF-yr. In other words, assuming single-use office would introduce an EUI error of over 30%.
To reduce this potential error in mixed-use buildings, EPIC enables users to select the mixed-use types contained in their building (EPIC supports up to 5 mixed-use spaces per building) and estimate the EUI, energy consumption and energy cost of each use and then aggregates the results at the whole building level.
Assuming the EPIC user does not have access to actual utility bill energy consumption data for each building use, EPIC first identifies the energy consumption of each use space based upon the building’s location (weather), use (EUI) and GFA. If each use type has its own independent heating and cooling system, EPIC will use the estimated end-use energy consumption of each use type to estimate the whole building’s energy savings.
If the EPIC user has access to whole building actual utility bill energy consumption data, EPIC enables the user to proportion these consumption data to each use type based upon the relative EUIs for each use type. EPIC then estimates end-use energy consumption for each use type based upon end-use percentages typically associated with the particular use type and building location.
Once EPIC calculates weather normalized energy end-use values for each use type, the EPIC user can input their proposed energy improvements and estimate energy savings based on the mixed-use building’s existing HVAC and other equipment infrastructure, i.e., whole building or per use area.
For mixed-use buildings the EPIC Report PDF includes key metrics for each use space in addition to the whole building-level.
How does EPIC apply Credits for mixed-use building scenarios?
Single-use buildings require one Credit and mixed-use buildings require one additional Credit – regardless of how many mixed-use spaces are included in a building. For example:
• Mixed-use scenario with 2 building use types = 2 Credits
• Mixed-use scenario with 4 building use types = 2 Credits
What is the existing heating source of a building?
For single-use buildings the existing heating source of the building is defined as the heating source for at least 75% of the gross floor area (GFA). This heating source may be a gas or oil-fired boiler or furnace, electric resistance heating, or a heat pump (which may be supplemented at low temperatures by a boiler/furnace or electric resistance heating). In the event there are multiple space heating systems, e.g., an electric heat pump that includes a supplemental heating source (electric resistance or natural gas) for cold weather, or a boiler system supplying the occupied floor space and electric resistance baseboard heating in stairways, only the building’s primary space heating source should be selected by the EPIC user. A primary source is one that conditions at least 75% of the building’s floor area.
For mixed-use buildings EPIC users have the option to enter the existing heating source for the whole building or for each use area.
What is the existing cooling source of a building?
For single-use buildings the existing cooling source of the building is defined as the cooling source for at least 75% of the gross floor area (GFA). This cooling source may be packaged rooftop or split system air conditioning units, PTAC units, a chiller plant (air- or water-cooled), or a heat pump system.
For mixed-use buildings EPIC users have the option to enter the existing cooling source for the whole building or for each use area.
Why does EPIC need to know the energy efficiency project type(s)?
Upon user entry of the project type(s), EPIC enables users to review and edit key parameters associated with “like-for-like” equipment replacement projects, e.g., replacing existing (less efficient) equipment with new (more efficient) equipment of the same type. Moreover, EPIC enables users to review and edit key parameters associated with whole building heating and cooling “system conversions” to a different technology, e.g., replacing natural gas-fired space heating and traditional air conditioning systems with an all-electric variable refrigerant flow (VRF) system or heat pumps.
Upon entry of equipment characteristics, EPIC estimates the energy savings resulting from installation of new equipment as compared to existing equipment, and calculates the financial impacts of each energy improvement. Such calculations are based on industry standard methodology, e.g., formulae defined in state utility technical resource manuals prepared in support of utility energy savings incentive programs.
What types of air conditioning projects does EPIC support?
EPIC supports various “like-for-like” air conditioning equipment replacement projects, for example:
- Efficient packaged RTU replacing an inefficient packaged RTU
- Efficient packaged RTU with supplemental electric reheat replacing an inefficient packaged RTU with supplemental electric reheat
- Efficient packaged RTU with supplemental natural gas reheat replacing an inefficient packaged RTU with supplemental natural gas reheat
- Efficient split system air conditioning system replacing an inefficient split system air conditioning system.
Moreover, EPIC supports scenario modeling in real time to estimate the energy cost savings associated with varying levels of energy efficiency performance-rated equipment, e.g., replacing existing inefficient equipment with energy code-compliant equipment, or replacing existing inefficient equipment with above-code more efficient equipment. These EPIC-enabled costs and savings analytics can then be compared in each case to determine the project economics when installing the higher efficiency equipment rather than just code-compliant equipment. The EPIC Report, summarizing the financial impacts, can be appended to your project proposal to illustrate the project economics of each equipment option to the property owner.
What types of Variable Refrigerant Flow projects does EPIC Support?
EPIC supports various heating and cooling system replacement projects with air-cooled Variable Refrigerant Flow (VRF) systems, also known as Variable Refrigerant Volume (VRV) systems, for example:
- VRF with or without heat recovery replacing conventional rooftop package, split system or multi-split system heat pumps.
- VRF with or without heat recovery replacing rooftop package, split system or multi-split system air conditioning units, or PTAC units.
- VRF with or without heat recovery replacing air or water-cooled chiller systems with gas-fired or oil-fired or electric resistance space heating systems.
Moreover, EPIC supports scenario modeling in real time to estimate the energy cost savings of VRF systems with and without heat recovery (simultaneous heating and colling). These EPIC-enabled costs and savings analytics can then be compared in each case to determine the project economics when installing the higher efficiency equipment rather than just code-compliant equipment. The EPIC Report, summarizing the financial impacts, can be appended to your project proposal to illustrate the project economics of each equipment option to the property owner.
What types of chiller system projects does EPIC support?
EPIC supports various “like-for-like” chiller system replacement projects, for example:
- Efficient water-cooled chiller replacing an inefficient water-cooled chiller
- Efficient air-cooled chiller replacing and an inefficient air-cooled chiller.
Moreover, EPIC supports scenario modeling in real time to estimate the energy cost savings associated with varying levels of energy efficiency performance-rated equipment, e.g., replacing existing inefficient equipment with energy code-compliant equipment, or replacing existing inefficient equipment with above-code more efficient equipment. These EPIC-enabled costs and savings analytics can then be compared in each case to determine the project economics when installing the higher efficiency equipment rather than just code-compliant equipment. The EPIC Report, summarizing the financial impacts, can be appended to your project proposal to illustrate the project economics of each equipment option to the property owner.
What types of DHW heating system projects does EPIC support?
EPIC supports various “like-for-like” DHW heating system replacement projects, for example:
- Instantaneous (tankless) electric DHW heater replacing an electric DHW heater with a water storage tank
- Instantaneous (tankless) gas-fired DHW heater replacing an inefficient gas-fired DHW heater with a water storage tank.
Moreover, EPIC supports fuel conversion projects for DHW heating systems. Although such projects may not create energy consumption savings, they may generate energy cost savings. Example projects might include:
- An electric DHW heater with a water storage tank being replaced by a gas-fired, non-condensing or condensing DHW heater with a water storage tank
- An electric DHW heater with a water storage tank being replaced by an instantaneous (tankless), non-condensing or condensing gas-fired DHW heater
How does EPIC estimate the building’s total capacity?
EPIC estimates the building’s total capacity based on the building’s key characteristics, e.g., property type, size, location (historical weather conditions), whole building energy consumption and system-level energy end-use estimates. For air condition equipment (RTUs, split systems, PTACs, chiller systems and heat pumps), EPIC estimates the building’s total cooling capacity need in tons. For boilers and furnaces, EPIC estimates the building’s total heating capacity need based on input Btu/hr (BTUH) capacity of the boiler or furnace. For DHW heating systems using a separate gas burner, EPIC estimates the building’s total DHW heating need based on BTUH capacity. For DHW heating systems using electricity, total capacity is estimated in kW.
EPIC users have the option to enter actual capacity values for their project’s equipment, where available, e.g., provided by the property owner or determined from a property inspection for two project scenarios:
- All equipment, i.e., whole building system replacement, for example, replacing six of six air conditioning RTUs
- Partial system equipment replacement, for example, replacing one of six air conditioning RTUs.
Why does EPIC use weather-normalized energy consumption data?
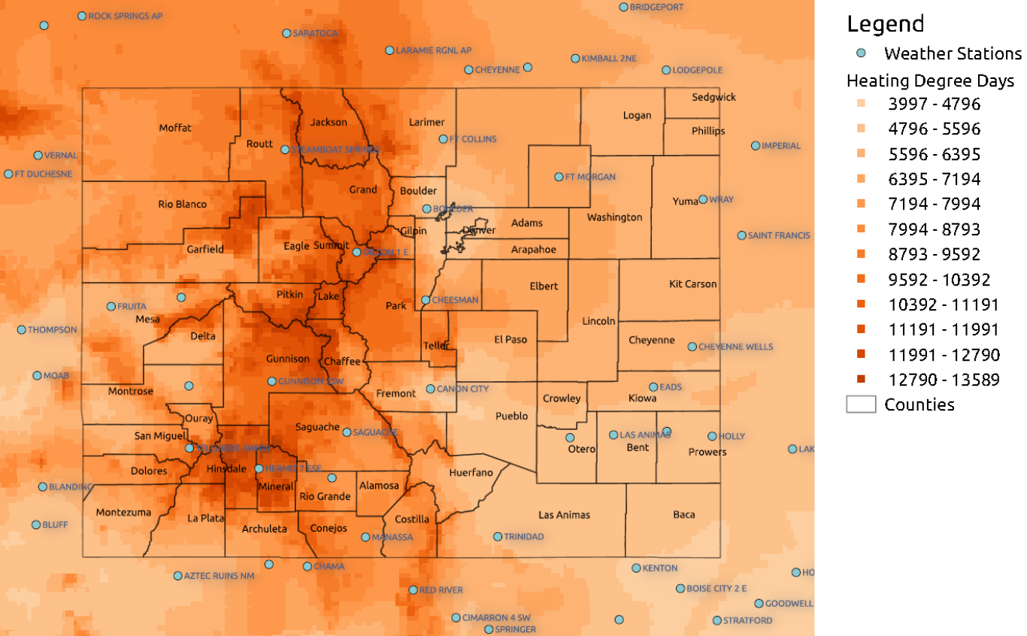
To remove the influence of weather and estimate energy savings that are representative of your property’s typical performance, EPIC uses weather normalized energy consumption data based on 20-30 years of data collected from the weather station(s) nearest the address of your property.
SRS’s proprietary weather normalization methodology:
- SRS collects weather data, on a daily basis, from over 1,200 U.S. weather stations that have a minimum 20 year historic heating degree day (HDD) and cooling degree day (CDD) dataset.
- SRS analyzes spatially historic HDD and CDD datasets deploying a proprietary geographic information system (GIS)-based “contiguous” HDD and CDD dataset. The result is a continually updated, SRS proprietary contiguous HDD and CDD database that facilitates property-level (latitude/longitude) weather normalization.
- As a result, the impact of weather conditions (from mild to harsh) on a project’s estimated energy savings are more accurately represented, as compared to the typical practice of simply using nearest weather station data.
The following map depicts SRS’s contiguous HDD dataset for Colorado:
What is the baseline energy consumption estimate based on?
EPIC calculates an estimate of your property’s baseline energy consumption, i.e., building energy consumption prior to installation of your project’s energy improvements. The baseline energy consumption estimate is based on U.S. Energy Information Administration’s (EIA) Commercial Building Energy Consumption Survey* (for commercial building types) or U.S. Department of Energy’s (DOE) Residential Energy Consumption Survey (specifically for multifamily buildings of 5 or more units). Such estimates are adjusted by EPIC to consider actual peer buildings’ energy use intensity in the same geographic area, were applicable, and includes the following assumptions:
- Energy consumption of your project’s building is comparable to that of peer buildings (median) in the same geographic area.
- Baseline efficiency for existing equipment is dictated by the ASHRAE 90.1 standard in effect at the time the building was constructed, or if known, the date the equipment was installed.
- Baseline natural gas or oil-fired heating equipment is assumed to be of the non-condensing type.
- HVAC controls are assumed to be pneumatic.
- DHW heating is assumed to be either electric with storage or gas-fired, non-condensing with storage.
- Lighting is assumed to be non-LED.
- Parking area lighting/ventilation electricity consumption is not included in building energy consumption.
EPIC users have the option, in the app’s Key Assumptions section, to input actual baseline energy consumption values for their property, where available, e.g., from historic utility bill data.
To learn more about how EPIC uses CBECS data, read Deciphering CBECS for Building Energy Consumption in our blog.
How does EPIC estimate my project's building energy consumption by end-use?
EPIC estimates your project’s building energy consumption by end-use (space heating, space cooling, water heating, lighting, etc.) based on U.S. Energy Information Administration’s (EIA) Commercial Building Energy Consumption Survey* (for commercial building types) or U.S. Department of Energy’s (DOE) Residential Energy Consumption Survey (specifically for multifamily buildings of 5 or more units), as adjusted by EPIC to remove the influence of weather, and consider peer buildings’ equipment infrastructure in the same geographic area. EPIC users have the option to adjust end-use percentage or numeric unit per year values, where applicable. Such values serve as the building’s weather normalized energy consumption by end-use and from which EPIC energy savings and financial impacts for user-selected improvements are determined.
To learn more about how EPIC uses CBECS data, read Deciphering CBECS for Building Energy Consumption in our blog.
How does EPIC calculate lifetime cost savings?
Lifetime cost savings equal the estimated savings (in dollars) over the useful life of the equipment. EPIC’s energy savings estimates include annual utility price escalation factors for electricity and fuels, and an annual performance degradation factor to account for the percent by which the equipment performance is forecast to degrade each year. The estimated useful life (EUL) of each improvement is based on third-party sources such as U.S. DOE, U.S. EPA, ASHRAE, and utility energy efficiency program technical resource manuals. Your project’s energy savings are assumed to persist over the term of each improvement’s EUL and are based on average weather conditions in the region over a 20-30 year period.
When the Tax Impacts Estimation feature is enabled in the Key Assumptions section, estimated increased income tax liabilities related to the energy cost savings are included in the lifetime savings. When the Depreciation Tax Impact feature is enabled, estimated income tax savings from depreciation are included in the lifetime savings.
Estimated income tax savings from depreciation is calculated by multiplying the depreciation by a blended federal and state income tax rate. Such blended rate is based on user-provided federal and state tax rates and reflects the estimated deductibility of state income taxes on the federal tax return. User-selectable depreciation options include a percentage for first year bonus depreciation and the depreciation method to be used for the remaining depreciation, i.e., accelerated (MACRS) or straight line, if first year bonus depreciation is less than 100%.
DISCLAIMER: Please note that, due to the potential variability of taxpayers’ circumstances, results generated by the Tax Impacts Estimation feature should be considered approximations and may not reflect the actual tax effects experienced by the taxpayer. Users who enable the Tax Impacts Estimation feature are responsible for providing appropriate federal and state income tax rates and depreciation options. Acceptance of EPIC’s default values will be considered acknowledgement by the user that the default values are appropriate. Results generated by the Tax Impacts Estimation feature should be evaluated by a tax professional to determine their accuracy and relevance to the taxpayer.
What is the savings to investment ratio?
SIR equals the ratio of project’s estimated savings over the projected useful life of the equipment to its installed cost. Savings estimates include average annual utility price escalation factors for electricity and fuels, and an annual performance degradation factor to account for the percent by which the equipment performance is forecast to degrade each year.
When the Tax Impacts Estimation feature is enabled in the Key Assumptions section, the project’s estimated savings will include income tax savings related to interest expense if a financing option, e.g., bank loan or PACE financing is selected, and increased income tax liabilities related to the project’s estimated energy cost savings. When the Depreciation Tax Impact feature is enabled in the Key Assumptions section, the project’s estimated savings will also include income tax savings from depreciation.
If the SIR is greater than 1.0, then the estimated savings from the improvements is greater than the initial required investment, indicating a positive net cash flow over the projected useful life of the equipment. Present value of the discounted lifetime savings is displayed in the Key Assumptions section, Key Financial Metrics subsection.
What does EPIC calculate once I enter my project's improvement(s)?
Once the user enables their project’s improvement(s), EPIC calculates key project metrics, i.e., estimated energy savings and financial impacts of such improvement(s). Moreover, EPIC allows users to conduct scenario analysis, by enabling or disabling improvements, to develop the optimized project based on key financial metrics. Upon user confirmation of their final selected improvement(s), EPIC allows users (via the Project Summary Section, PDF Report option) to prepare an EPIC Report in real time. This report summarizes the project’s estimated energy savings and annual operating cost reductions and can be appended to the user’s project proposal to ensure the property owner has the information needed to make a fully-informed, expedited investment decision.
What key project metrics does EPIC calculate?
EPIC calculates key project metrics, i.e., estimated energy savings and financial impacts of both user-enabled and disabled improvement(s). This methodology enables EPIC users to conduct scenario analysis in real time, by enabling or disabling improvements, to develop the optimized project based on key financial metrics. Upon user confirmation of their final selected improvement(s), EPIC allows users (via the Project Summary section, PDF Report option), to prepare an EPIC Report in real time. This report summarizes the project’s estimated energy savings and annual operating cost reductions and can be appended to the user’s project proposal to ensure the property owner has the information needed to make a fully-informed, expedited investment decision.
What does EPIC's estimated installed cost for high efficiency air conditioning equipment represent?
EPIC’s estimated installed cost for high efficiency air conditioning equipment, derived from SRS’s energy efficiency project database, represents the average installed cost for high efficiency packaged or split system air conditioning equipment with economizer and dual enthalpy control, scroll compressors, VAV, etc. based upon the cost for such equipment installed in peer buildings in the same geographic area. Such estimates are adjusted based on the subject building’s type, size and weather normalized energy consumption. Installed cost estimates exclude any assumption for utility incentives or rebates. EPIC users have the option to enter their building’s actual project installed cost, including gross cost and utility incentives or rebates in the calculation of “net” project installed cost, where applicable.
To learn about the EPIC-IQ feature to update the installed cost of energy improvements based on user edits to select equipment characteristics, click here.
What does EPIC's estimated installed cost for LED lighting represent?
EPIC’s estimated installed cost for LED lighting, derived from SRS’s energy efficiency project database, represents the average installed cost for a whole building LED lighting upgrade, including occupancy sensors where appropriate, based upon the cost for such equipment installed in peer buildings in the same geographic area. Such estimates are adjusted based on the subject building’s type and size. EPIC prepopulates an estimated utility rebate equal to 30% of the gross cost, which represents the average incentive associated with LED lighting projects in SRS’s database. EPIC users have the option to enter their building’s actual project installed cost, including gross cost and utility incentives or rebates in the calculation of “net” project installed cost, where applicable.
To learn about the EPIC-IQ feature to update the installed cost of energy improvements based on user edits to select equipment characteristics click here.
What does EPIC’s installed cost for an EMS with DDC represent?
EPIC’s estimated installed cost for an energy management systems (EMS) with direct digital control (DDC) providing monitoring, optimization and demand response capabilities, derived from SRS’s energy efficiency project database, represents the average installed cost for such equipment in peer buildings. Such estimates are adjusted based on the subject building’s type, size and weather normalized energy consumption. Installed cost estimates exclude any assumption for utility incentives or rebates. EPIC users have the option to enter their building’s actual project installed cost, including gross cost and utility incentives or rebates in the calculation of “net” project installed cost, where applicable.
To learn about the EPIC-IQ feature to update the installed cost of energy improvements based on user edits to select equipment characteristics click here.
What does EPIC’s estimated installed cost for attic/roof insulation represent?
EPIC’s estimated installed cost for attic/roof insulation, derived from SRS’s energy efficiency project database, represents the average installed cost for attic/roof insulation based upon the cost for similar installations in peer buildings in the same geographic area. Such estimates are adjusted based on the subject building’s attic/roof square footage area, existing and new R-Values, and weather normalized energy consumption. Installed cost estimates exclude any assumption for utility incentives or rebates. EPIC users have the option to enter their building’s actual project installed cost, including gross cost and utility incentives or rebates in the calculation of “net” project installed cost, where applicable.
To learn about the EPIC-IQ feature to update the installed cost of energy improvements based on user edits to select equipment characteristics click here.
What does EPIC’s estimated installed cost for walls insulation represent?
EPIC’s estimated installed cost for walls insulation, derived from SRS’s energy efficiency project database, represents the average installed cost for walls insulation based upon the cost for similar installations in peer buildings in the same geographic area. Such estimates are adjusted based on the subject building’s wall square footage area (including an assumption for window area), existing and new R-Values, and weather normalized energy consumption. Installed cost estimates exclude any assumption for utility incentives or rebates. EPIC users have the option to enter their building’s actual project installed cost, including gross cost and utility incentives or rebates in the calculation of “net” project installed cost, where applicable.
To learn about the EPIC-IQ feature to update the installed cost of energy improvements based on user edits to select equipment characteristics click here.
What does EPIC’s estimated installed cost for air sealing represent?
EPIC’s estimated installed cost for air sealing, derived from SRS’s energy efficiency project database, represents the average installed cost for air sealing based upon the cost for similar installations in peer buildings in the same geographic area. Such estimates are adjusted based on the subject building’s square footage area, including the estimated number of windows and exterior doors. Installed cost estimates exclude any assumption for utility incentives or rebates. EPIC users have the option to enter their building’s actual project installed cost, including gross cost and utility incentives or rebates in the calculation of “net” project installed cost, where applicable.
What does EPIC’s estimated installed cost for replacement windows represent?
EPIC’s estimated installed cost for replacement windows, derived from SRS’s energy efficiency project database, represents the average installed cost for insulated, high-gain, argon-filled windows based upon the cost for similar installations in peer buildings in the same geographic area. Such estimates are adjusted based on the subject building’s estimated window area (sq. ft.) and location. Installed cost estimates exclude any assumption for utility incentives or rebates. EPIC users have the option to enter their building’s actual project installed cost, including gross cost and utility incentives or rebates in the calculation of “net” project installed cost, where applicable.
To learn about the EPIC-IQ feature to update the installed cost of energy improvements based on user edits to select equipment characteristics click here.
How does EPIC estimate the default value for attic/roof and walls square footage area?
EPIC estimates the default value for a building’s attic/roof and wall square footage area as follows:
Attic/Roof:
– For single story buildings: EPIC estimates the attic/roof square footage area to be equal to the building’s gross square footage.
– For multi-story buildings: EPIC estimates the attic/roof square footage area based on the building’s gross square footage divided by the number of stories.
Walls:
– To estimate the default value for square footage area of the walls, EPIC assumes the building’s configuration is consistent with that of a typical apartment building’s ratio for width, depth, wall height, and window area-to-wall area.
EPIC users have the option to enter actual attic/roof/wall square footage area, where available, e.g., as determined from a property inspection.
How does EPIC estimate the default value for roof square footage area?
EPIC estimates the default value for a building’s roof square footage area as follows:
– For single story buildings: EPIC estimates the roof square footage area to be equal to the building’s gross square footage.
– For multi-story buildings: EPIC estimates the roof square footage area based on the building’s gross square footage divided by the number of stories.
EPIC users have the option to enter actual roof square footage area, where available, e.g., as determined from a property inspection.
What does EPIC's estimated installed cost for roof replacement represent?
EPIC’s estimated installed cost for roof replacement, derived from SRS’s project database, represents the average installed cost for roofing projects based upon the cost for similar installations in peer buildings in the same geographic area. Such estimates assume removal of the existing roof and installation of an EPDM (Ethylene Propylene Diene Monomer) membrane with R-18 new polyisocyanurate insulation. Cost estimates are adjusted based on the building’s roof square footage area and location. Installed cost estimates exclude any assumption for utility incentives or rebates. EPIC users have the option to enter their building’s actual project installed cost, including gross cost and utility incentives or rebates in the calculation of “net” project installed cost, where applicable.
To learn about the EPIC-IQ feature to update the installed cost of energy improvements based on user edits to select equipment characteristics click here.
How does EPIC estimate the percent heating savings for a DDC EMS controlling building HVAC?
EPIC’s estimated percent heating savings, derived from SRS’s energy efficiency project database, represents the average percent heating savings for a direct digital control (DDC) energy management system (EMS) controlling building HVAC installed in peer buildings in the same geographic area. This percent savings is applied to weather normalized heating end-use energy consumption to estimate heating savings. EPIC assumes the DDC EMS installed is controlling the HVAC system and is providing monitoring, optimization and demand response to replace a conventional (thermostatic) pneumatic control system. If lighting or other HVAC energy improvements are enabled in EPIC, then the EMS percent savings is applied to the post-improvement’s weather normalized heating end-use energy consumption.
How does EPIC estimate the percent cooling savings for a DDC EMS controlling building HVAC?
EPIC’s estimated percent cooling savings, derived from SRS’s energy efficiency project database, represents the average percent cooling savings for a direct digital control (DDC) energy management system (EMS) controlling building HVAC installed in peer buildings in the same geographic area. This percent savings is applied to weather normalized cooling end-use energy consumption to estimate cooling savings. EPIC assumes the DDC EMS installed is controlling the HVAC system and is providing monitoring, optimization and demand response to replace a conventional (thermostatic) pneumatic control system. If lighting or other HVAC energy improvements are enabled in EPIC, then the EMS percent savings is applied to the post-improvement’s weather normalized cooling end-use energy consumption.
How does EPIC estimate the percent ventilation savings for a DDC EMS controlling building HVAC?
EPIC’s estimated percent ventilation savings, derived from SRS’s energy efficiency project database, represents the average percent ventilation savings for a direct digital control (DDC) energy management system (EMS) controlling building HVAC installed in peer buildings in the same geographic area. This percent savings is applied to weather normalized ventilation end-use energy consumption to estimate ventilation savings. Ventilation savings apply for both cooling and heating conditions. EPIC assumes the DDC EMS installed is controlling the HVAC system and is providing monitoring, optimization and demand response to replace a conventional (thermostatic) pneumatic control system. If lighting or other HVAC energy improvements are enabled in EPIC, then the EMS percent energy savings is applied to the post-improvement’s weather normalized ventilation end-use energy consumption.
How does EPIC estimate VRF system fan energy savings associated with installation of a new Dedicated Outdoor Air System?
A VRF system can significantly reduce fan air flow (and duct pressure) resulting in significant fan energy savings. In building retrofit projects, a new VRF system no longer requires the air flow associated with the existing system distributing space heating and cooling. Rather, it only requires ventilation air flow dictated by energy code requirements. EPIC estimates fan energy savings (kWh per year) associated with a newly installed VRF Dedicated Outdoor Air System (DOAS) using a kWh savings per building square foot assumption. As a quality assurance check, this kWh fan energy savings is compared to the building’s baseline weather normalized ventilation end-use (kWh per year). EPIC users have the option to enter their preferred ventilation end-use savings value for their VRF project, where available.
What does EPIC's installed cost for high efficiency DHW heating systems represent?
EPIC’s estimated installed cost for high efficiency DHW heating systems, derived from SRS’s energy efficiency project database, represents the average installed cost for either an instantaneous natural gas-fired condensing unit or instantaneous electric water heater with storage based upon the cost for such equipment in peer buildings in the same geographic area. Such estimates are adjusted based on the subject building’s type, size and weather normalized energy consumption. Installed cost estimates exclude any assumption for utility incentives or rebates. EPIC users have the option to enter their building’s actual project installed cost, including gross cost and utility incentives or rebates in the calculation of “net” project installed cost, where applicable.
To learn about the EPIC-IQ feature to update the installed cost of energy improvements based on user edits to select equipment characteristics click here.
What does EPIC's installed cost for a high efficiency space heating system represent?
EPIC’s estimated installed cost for high efficiency space heating system, derived from SRS’s energy efficiency project database, represents the average installed cost for high efficiency condensing units installed in peer buildings in the same geographic area. Such estimates are adjusted based on the subject building’s type, size and weather normalized energy consumption. Installed cost estimates exclude any assumption for utility incentives or rebates. EPIC users have the option to enter their building’s actual project installed cost, including gross cost and utility incentives or rebates in the calculation of “net” project installed cost, where applicable.
To learn about the EPIC-IQ feature to update the installed cost of energy improvements based on user edits to select equipment characteristics click here.
How does EPIC define project types for combined air conditioning/heating systems?
EPIC’s project type definition for combined air conditioning/heating systems is determined as follows:
- Electric resistance: EPIC users should select the air conditioning project type.
- Natural gas: EPIC users should select the air conditioning project type.
- Hot water: EPIC’s project type definition is dependent upon whether the boiler is being replaced:
- Boiler replacement: In hot water combined systems where the boiler is being replaced, EPIC users should select both:
- Space heating system: to estimate the savings associated with the boiler replacement.
- Air conditioning: to estimate the savings associated with the air conditioning system replacement.
- No boiler replacement: In a combined system using hot water for space heating, where the boiler is not being replaced, EPIC users should select the air conditioning project type.
- Boiler replacement: In hot water combined systems where the boiler is being replaced, EPIC users should select both:
What types of space heating system projects does EPIC support?
EPIC supports various “like-for-like” space heating system replacement projects, for example:
- Efficient gas-fired boiler (typically condensing) replacing an inefficient gas-fired boiler (typically non-condensing)
- Efficient oil-fired boiler replacing an inefficient oil-fired boiler.
Moreover, EPIC supports scenario modeling in real time to estimate the energy cost savings associated with varying levels of energy efficiency performance-rated equipment, e.g., replacing existing inefficient equipment with energy code-compliant equipment, or replacing existing inefficient equipment with above-code more efficient equipment. These EPIC-enabled costs and savings analytics can then be compared in each case to determine the project economics when installing the higher efficiency equipment rather than just code-compliant equipment. The EPIC Report, summarizing the financial impacts, can be appended to your project proposal to illustrate the project economics of each equipment option to the property owner.
Currently, EPIC does not support fuel switching projects, e.g., oil-fired boiler conversion to gas-fired boiler.
What does EPIC's installed cost for a high efficiency chiller system represent?
EPIC’s estimated installed cost for high efficiency chiller system, derived from SRS’s energy efficiency project database, represents the average installed cost for a high efficiency air- or water-cooled chiller plant with rotary scroll compressor installed in peer buildings in the same geographic area. Such estimates are adjusted based on the subject building’s type, size and weather normalized energy consumption. Installed cost estimates exclude any assumption for utility incentives or rebates. EPIC users have the option to enter their building’s actual project installed cost, including gross cost and utility incentives or rebates in the calculation of “net” project installed cost, where applicable.
To learn about the EPIC-IQ feature to update the installed cost of energy improvements based on user edits to select equipment characteristics, click here.
What does EPIC's installed cost for high efficiency heat pumps represent?
EPIC’s estimated installed cost for high efficiency heat pumps, derived from SRS’s energy efficiency project database, represents the average installed cost for such equipment installed in peer buildings in the same geographic area. Such estimates are adjusted based on the subject building’s type, size and weather normalized energy consumption. Installed cost estimates exclude any assumption for utility incentives or rebates. EPIC users have the option to enter their building’s actual project installed cost, including gross cost and utility incentives or rebates in the calculation of “net” project installed cost, where applicable.
To learn about the EPIC-IQ feature to update the installed cost of energy improvements based on user edits to select equipment characteristics, click here.
What does EPIC’s installed cost for VRF equipment represent?
EPIC’s estimated installed cost for variable refrigerant flow (VRF) equipment, derived from SRS’s energy efficiency project database, represents the average installed cost for such equipment installed in peer buildings in the same geographic area. Such estimates are adjusted based on the subject building’s type, size, weather normalized energy consumption, and whether a new dedicated outdoor air system (DOAS) is included. Installed cost estimates exclude any assumption for utility incentives or rebates. EPIC users have the option to enter their building’s actual project installed cost, including gross cost and utility incentives or rebates in the calculation of “net” project installed cost, where applicable.
To learn about the EPIC-IQ feature to update the installed cost of energy improvements based on user edits to select equipment characteristics, click here.
How does EPIC estimate existing equipment EER?
EPIC estimates existing equipment EER (energy efficiency ratio) based on the property’s year of construction, as follows:
- Building >25 years old: If the age of existing equipment is unknown all existing equipment is assumed to be 25 years old for purposes of establishing the equipment’s baseline EER.
- Building <25 years old: If the age of existing equipment is unknown all existing equipment is assumed to be equivalent to the age of the building for purposes of establishing the equipment’s baseline EER.
Upon estimation of existing equipment age, EPIC assumes the EER is consistent with the ASHRAE 90.1 standard in effect at the time existing equipment was installed.
EPIC users have the option to enter actual EER values for their project’s equipment, where available, e.g., provided by the property owner or determined from a property inspection.
How does EPIC estimate VRF replacement equipment CoP?
EPIC estimates space heating savings for VRF systems using the coefficient of performance (CoP) relationship with outdoor air temperature. Moreover, EPIC calculates typical heating degree days (HDD) based upon a minimum 20-years’ historic average daily temperature data from the weather station nearest the address of your property. Building space heating energy consumption as a function of HDD, and VRF CoP as a function of outdoor air temperature are used to estimate the annual space heating energy consumption of the VRF system. Based on your property’s location, EPIC also calculates the average annual CoP for the VRF system. EPIC users have the option to enter their preferred average annual CoP value, where available.
How does EPIC estimate replacement equipment EER/IEER?
EPIC assumes the EER (energy efficiency ratio) / IEER (integrated energy efficiency ratio) of new equipment is at the average performance level in this category of equipment as derived from SRS’s energy efficiency project database. EPIC users have the option to enter actual EER or IEER values for their specific replacement equipment, e.g., code compliant EER/IEER or code exceedance high efficiency EER/IEER, etc. Moreover, EPIC enables users, via My Preferences, to set their preferred IEER default value for VRF equipment.
How does EPIC estimate existing equipment combustion efficiency percent?
EPIC estimates existing equipment combustion efficiency percent based on the property’s year of construction, as follows:
-
-
-
- Building >25 years old: If the age of existing equipment is unknown all existing equipment is assumed to be 25 years old for purposes of establishing the equipment’s baseline combustion efficiency percent.
- Building <25 years old: If the age of existing equipment is unknown all existing equipment is assumed to be equivalent to the age of the building for purposes of establishing the equipment’s baseline combustion efficiency percent.
-
-
Upon estimation of existing equipment age, EPIC assumes the combustion efficiency percent is consistent with the ASHRAE 90.1 standard in effect at the time existing equipment was installed.
EPIC users have the option to enter actual combustion efficiency percent values for their project’s equipment, where available, e.g., provided by the property owner or determined from a property inspection.
How does EPIC estimate replacement equipment combustion efficiency percent?
EPIC assumes the combustion efficiency percent of new equipment is at the average efficiency performance level in this category of equipment as derived from SRS’s energy efficiency project database. EPIC users have the option to enter actual combustion efficiency percent values for their specific replacement equipment, e.g., code compliant or code exceedance high efficiency percent, etc.
How does EPIC use the energy consumption and cost estimates?
The energy cost assumptions are used by EPIC to estimate energy savings and calculate financial impacts for your project. Such cost estimates are based on U.S. Energy Information Administration’s (EIA) average commercial rates. These cost estimates, pre-populated by EPIC, are based on the assumption that your project’s building is comparable, i.e., operates similarly, to that of peer buildings in the same geographic area. EPIC users have the option, in the app’s Key Assumptions section, to enter actual energy cost values for their property, where available, e.g., from historic utility bill data.
How does EPIC use the discount rate?
EPIC uses the discount rate to calculate the net present value (NPV) of the future stream of estimated cash flows resulting from the installation of your project’s energy improvements. NPV is calculated using the projected cash flows over the energy improvement(s) maximum estimated useful life (EUL) term and the discount rate specified in the key assumptions section. EPIC users have the option to enter the property owner’s preferred discount rate for use in EPIC’s NPV calculation, where applicable.
How does EPIC use the capitalization rate?
EPIC uses the capitalization (CAP) rate to calculate the estimated property value increase resulting from the installation of your project’s energy improvements. Property value increase is calculated as the ratio between estimated average annual savings and estimated CAP rate, based on your property type and location. EPIC users have the option to enter the property owner’s preferred CAP rate for use in EPIC’s property value increase calculation, where applicable.
How does EPIC use the energy cost assumptions?
The energy cost assumptions are used by EPIC to estimate energy savings and calculate financial impacts for your project. Such cost estimates are based on U.S. Energy Information Administration’s (EIA) average commercial rates. These cost estimates, pre-populated by EPIC, are based on the assumption that your project’s building is comparable, i.e., operates similarly, to that of peer buildings in the same geographic area. EPIC users have the option, in the app’s Key Assumptions section, to enter actual energy cost values for their property, where available, e.g., from historic utility bill data.
How does EPIC use the energy consumption assumptions?
The energy consumption assumptions are used by EPIC to estimate energy consumption and calculate financial impacts for your project. Such data, which is pre-populated by EPIC, is based on the assumption that your project’s building is comparable, i.e., operates similarly, to that of peer buildings in the same geographic area. EPIC users have the option to enter actual energy consumption values for their property, where available, e.g., from historic utility bill data.
What are the benefits of PACE financing?
PACE (Property Assessed Clean Energy) provides affordable, long-term financing for energy improvements. Financing is provided by private capital providers. Repayment is through a voluntary assessment on the property (similar to a sewer assessment). Key benefits include:
-
-
-
- 100% financing (no out-of-pocket costs)
- Long-term (up to 20 years; repayment obligation can be transferred upon property sale)
- No personal guarantee required.
-
-
Contact us to learn more about how SRS can help you identify experienced PACE capital providers to finance your project.
How does EPIC estimate electricity savings?
EPIC’s estimated electricity savings resulting from installation of energy improvements is determined via a two-step process:
-
-
-
- EPIC estimates the percent energy consumption savings resulting from installation of new equipment as compared to existing equipment. EPIC calculates this percent energy consumption savings using industry standard methodology, e.g., formulae defined in state utility technical resource manuals prepared in support of utility energy savings incentive programs.
- EPIC estimates the weather normalized electricity (kWh/yr) associated with the new equipment’s energy end-use. This end-use consumption value is then multiplied by the percent energy consumption savings to calculate the annual electricity savings (kWh/yr).
-
-
How does EPIC estimate peak demand reduction?
EPIC supports peak electric demand reduction estimates for lighting and air conditioning improvements, e.g., RTUs, PTACs, chiller systems, split systems and cooling associated with heat pumps.
EPIC’s estimated peak electric demand reduction resulting from installation of energy improvements is calculated based on applicable energy efficiency metrics, e.g., EER, associated with the existing and new equipment, including the equipment’s capacity, e.g., tons. An average coincidence factor is applied where appropriate in the calculation of peak demand reduction.
EPIC calculates this peak electric demand reduction using industry standard methodology, e.g., formulae defined in state utility technical resource manuals prepared in support of utility energy savings incentive programs. Peak demand is determined monthly (consistent with utility billing) and applied each month the peak demand savings are realized. Total annual demand savings is the monthly demand savings multiplied by the number of months the demand reduction will take place. For example, cooling demand reduction will only take place in the months that space cooling is taking place.
For like-for-like replacements of boilers and furnaces with high efficiency boilers and furnaces, e.g., replacing existing non-condensing boilers and furnaces with high efficiency condensing types, EPIC does not estimate a fuel demand savings which is assumed to be minor. However, when a fuel switch is taking place, i.e., natural gas use being eliminated in an electrification project, EPIC does estimate the fuel demand reduction, including the application of a coincidence factor of 1.0 for all property types.
When multiple ECMs are being installed, EPIC aggregates each individual ECM impact on peak demand, assuming negligible coincidental peak demand effect (between multiple ECMs). This provides a reasonable estimate for like-to-like replacement since EPIC focuses on the change, i.e., delta, in maximum peak demand (savings or penalty) between the baseline and post-ECM installation. To better estimate any coincidental peak demand impact resulting from multiple operating ECMs, a building simulation model can be run reflecting, among other things, the building type and geographic location, individual equipment operating schedules over the year, and the specific combination of ECMs selected for installation.
In addition, EPIC assumes the utility tariff does not include a ratchet provision. If there is such a provision, first year demand savings may not be applicable, however, there would be no impact to the savings beyond the first year.
What is a ratchet provision?
Utility tariffs may contain a ratchet provision that imposes a minimum demand charge throughout the year based on the highest peak demand reached over the prior year. Assuming the ratchet is 100% (although it may be lower), then for the next twelve months the utility sets the minimum Billed Demand equal to 100% of the maximum recorded peak kW over the prior twelve-month period, regardless of the actual demand.
Therefore, even if you install energy efficiency improvements that reduce the demand, for the next twelve months you will continue to be billed at 100% of your previously recorded (pre-energy efficiency improvement) peak demand. The utility bill will typically identify Read Demand and Billed Demand; however, your charge will be based on Billed Demand (ratchet). Hence, if you projected a demand cost savings in the year following the energy efficiency improvements, unless the utility tariff indicates otherwise, this savings would not be realized by the building owner until after the ratchet expires.
How does EPIC estimate fuel savings?
EPIC’s estimated fuel savings resulting from installation of energy improvements is determined via a two-step process:
-
-
-
- EPIC estimates the percent energy consumption savings resulting from installation of new equipment as compared to existing equipment. EPIC calculates this percent energy consumption savings using industry standard methodology, e.g. formulae defined in state utility technical resource manuals prepared in support of utility energy savings incentive programs.
- EPIC estimates the weather normalized fuel consumption associated with the new equipment’s energy end-use. This end-use consumption value is then multiplied by the percent energy savings to calculate the annual fuel savings.
-
-
How does EPIC estimate CO2e emissions reduction?
Carbon emissions represent the amount of carbon dioxide equivalent, CO2e (representing emissions of the combustion-related greenhouse gases (GHGs): carbon dioxide, methane, and nitrous oxide) emitted annually to the atmosphere from combustion of fossil fuels to produce heat and power for the building. Total CO2e is determined for both direct and indirect emissions. Direct emissions result from on-site combustion of fuels such as natural gas. Indirect emissions result from off-site combustion of fuels at power plants that deliver electricity to the grid.
EPIC estimates a building’s direct CO2e emissions using U.S. EPA Emission Factors for on-site combustion, for example, natural gas used in building heating. These are available in U.S. EPA, Center for Corporate Climate Leadership, Greenhouse Gas Inventory Guidance, Direct Emissions from Stationary Combustion Sources, Appendix A, Table A-1, December 2020.
The building’s electricity usage (kWh) is used to estimate indirect carbon emissions associated with purchased electricity. EPIC obtains these emission factors from EPA’s eGRID2021 (released in January 2023) representing 2021 data and fuel mix by state. Non-baseload output emission rates are used to determine the annual CO2e emissions that are avoided through projects that displace marginal fossil fuel generation, such as energy efficiency and/or renewable energy projects. The indirect CO2e emission factors in EPIC also reflect transmission and distribution losses (estimated in eGrid2021 at 4.5%).
How does EPIC calculate the estimated useful life of energy improvements?
The estimated useful life (EUL) of each energy improvement is based on third-party sources such as U.S. DOE, U.S. EPA, ASHRAE, and state utility energy efficiency program technical resource manuals. EPIC users have the option to edit these prepopulated EUL values, where applicable.
How does EPIC estimate the electricity savings percent for LED lighting projects?
EPIC’s estimated electricity savings percent, derived from SRS’s energy efficiency project database, represents the average percent savings for LED lighting installed in peer buildings in the same geographic area. This percent savings is applied to the weather normalized electricity (kWh/yr) consumption associated with the building’s lighting end-use to estimate electricity savings. EPIC assumes that LED lighting is installed to replace a conventional non-LED, e.g., T-12, T-8, etc., lighting system.
In addition, EPIC estimates the interactive effects of an LED lighting upgrade, i.e., space cooling energy consumption in the summer will decrease and space heating energy consumption in the winter will increase. These interactive effects are estimated using factors derived from state utility Technical Resource Manuals. Cooling savings are estimated in kWh assuming the HVAC system includes an economizer, and the coefficient of performance (COP) is 3.5. The space heating penalty is estimated in MMBtu per annual kWh saved using a factor depending on the fuel type.
Moreover, EPIC estimates demand reduction from the installation of LED lighting with occupancy sensors, including the application of summer and winter coincidence factors (CF) based on the property type. These CF factors are derived from state utility Technical Resource Manuals.
How does EPIC estimate existing equipment full load and part load energy efficiency?
EPIC estimates existing equipment energy efficiency metrics, i.e., full load value (FLV) and integrated part load value (IPLV) in kW/ton based on the property’s year of construction, as follows:
- Building >25 years old: If the age of existing equipment is unknown all existing equipment is assumed to be 25 years old for purposes of establishing the equipment’s baseline FLV and IPLV.
- Building <25 years old: If the age of existing equipment is unknown all existing equipment is assumed to be equivalent to the age of the building for purposes of establishing the equipment’s baseline FLV and IPLV.
Upon estimation of existing equipment age, EPIC assumes the FLV and IPLV is consistent with the ASHRAE 90.1 standard in effect at the time existing equipment was installed.
EPIC users have the option to enter actual FLV and IPLV for their project’s equipment, where available, e.g., provided by the property owner or determined from a property inspection.
How does EPIC estimate new equipment full load and part load energy efficiency?
EPIC assumes the full load value (FLV) and integrated part load value (IPLV) in kW/ton of new equipment is at the average performance level in this category of equipment as derived from SRS’s energy efficiency project database. This performance level is associated with dual stage compression, all variable speed, design and operational optimization, etc. EPIC users have the option to enter actual FLV and IPLV for their specific replacement equipment, e.g., code compliant FLV/IPLV or code exceedance high efficiency FLV/IPLV, etc.
How does EPIC estimate interactive effects for multi-improvement projects?
By clicking on the icons next to the improvement’s name, EPIC users can enable/disable improvements, edit key parameters, e.g., 100% or partial replacement, existing and replacement equipment EER or combustion efficiency, and change the sequential order within the energy improvements section in the table.
EPIC’s estimated savings for multiple energy improvements considers the interactive effects assuming implementation in the sequence displayed in the energy improvements table. EPIC users have the option, via the 3 dots icon, to drag and drop an improvement to change its order in the table. This sequencing feature enables EPIC users to optimize their project considering the interactive cost and savings effects of multiple improvements. Moreover, sequencing is designed to avoid double counting and overestimating energy savings in comprehensive, multi-improvement projects.
For example, if an LED lighting upgrade is displayed first, followed by a new space heating system, the LED lighting would increase the building’s space heating load (LED’s generate less heat than fluorescent fixtures). The resulting increased space heating load would then become the new post-LED installation space heating load. The new space heating system’s estimated energy savings would then be calculated using this post-LED installation space heating end-use value.”
As a second example, an EPIC user could add an evaporative pre-cooler upstream of a new high efficiency air conditioning system. This combination would affect the cooling end-use (kWh per year). By appearing in the list of improvements after the air conditioning improvement, the evaporative pre-cooler’s energy consumption savings will be calculated using the “remaining” cooling end-use energy consumption after the air conditioning improvement’s impact on cooling energy end-use is calculated. As a result, EPIC accounts for the impact the new more efficient air conditioning system has on the building’s cooling energy end-use, while avoiding double counting energy savings.
How does EPIC-IQ update estimated installed cost for energy improvements?
EPIC-IQ will update the Net Installed Cost of energy improvements based on user edits to select equipment characteristics. For example:
-
- Air conditioning (RTU, Split System, PTAC): When EPIC users edit Total Capacity and click “Submit”, EPIC-IQ will update the Net Installed Cost value, displayed in italics with grey background, based on SRS’s Air Conditioning project database’s average cost per unit. Note: For multifamily apartment buildings, EPIC-IQ will update the Net Installed Cost value when EPIC users edit the Number of Units on the Building Information page.
- Chiller System: When EPIC users edit Total Capacity and click “Submit”, EPIC-IQ will update the Net Installed Cost value, displayed in italics with grey background, based on SRS’s Chiller System project database’s average cost per unit.
- DHW Heating: When EPIC users edit Total Capacity and click “Submit”, EPIC-IQ will update the Net Installed Cost value, displayed in italics with grey background, based on SRS’s DHW Heating System project database’s average cost per unit.
- EMS (DDC): When EPIC users edit Building Area (gross sq. ft.) and click “Submit”, EPIC-IQ will update the Net Installed Cost value, displayed in italics with grey background, based on SRS’s EMS (DDC) project database’s average cost per square foot.
- Heat Pumps: When EPIC users edit Total Cooling Capacity and click “Submit”, EPIC-IQ will update the Net Installed Cost value, displayed in italics with grey background, based on SRS’s Heat Pumps project database’s average cost per unit. Note: For multifamily apartment buildings, EPIC-IQ will update the Net Installed Cost when EPIC users edit the Number of Units on the Building Information page.
- Insulation (Attic/Roof and Walls): When EPIC users edit Area Sq. Ft., Existing R-Value, or New R-Value and click “Submit”, EPIC-IQ will update the Net Installed Cost value, displayed in italics with grey background, based on SRS’s Insulation project cost database. Note: EPIC’s support of Insulation projects is limited to multifamily apartment buildings.
- LED Lighting: When EPIC users select “Advanced” mode, edit Replacement Percentage, and click “Submit”, EPIC-IQ will update the Net Installed Cost value, displayed in italics with grey background, based on SRS’s LED Lighting project database’s average cost per square foot per property type.
- Roofing: When EPIC users edit Area Sq. Ft., New R-Value or Membrane Type and click “Submit”, EPIC-IQ will update the Net Installed Cost value, displayed in italics with grey background, based on SRS’s Roofing project cost database. Note: EPIC’s support of Roofing projects excludes multifamily apartment buildings.
- Solar PV: When EPIC users edit Solar PV System Size in kW DC and click “Submit”, EPIC-IQ will update the Net Installed Cost value, displayed in italics with grey background, based on SRS’s Solar PV System project database’s average cost per watt.
- Space Heating: When EPIC users edit Total Capacity and click “Submit”, EPIC-IQ will update the Net Installed Cost value, displayed in italics with grey background, based on SRS’s Space Heating System project database’s average cost per unit.
- Variable Refrigerant Flow (VRF/VRV): When EPIC users edit Total Cooling Capacity, select/deselect Dedicated Outdoor Air System, and click “Submit”, EPIC-IQ will update the Net Installed Cost value, displayed in italics with grey background, based on SRS’s VRF project database’s average cost per unit.
- Windows: When EPIC users edit Windows Area (sq. ft.) and click “Submit”, EPIC-IQ will update the Net Installed Cost value, displayed in italics with grey background, based on SRS’s Windows project database’s average cost per square foot. Note: EPIC’s support of Windows projects is limited to multifamily apartment buildings.
How does EPIC estimate Coincidence Factors in demand calculations?
The coincidence factor (CF) represents the fraction of the connected load reduction expected to occur at the same time as a particular system’s peak period. This fraction is multiplied by the gross demand energy savings, e.g., kW, determined by the energy conservation measure (ECM) to calculate the portion of this gross demand coincident with the on-peak period. If the entire gross demand energy savings is coincident with the on-peak period, the CF would be equal to 1.00. Separate coincidence factors may exist for summer and winter peak periods.
EPIC estimates an ECM’s applicable coincidence factor(s) using averages cited in state utility technical resource manuals and SRS’s project experience database. For example, gross demand reduction calculated in EPIC for space cooling uses a summer coincidence factor of 0.84 for all property types. When a fuel switch takes place, such as in an electrification project where a VRF system (essentially an enhanced heat pump) is replacing an existing roof-top air conditioning system and a natural gas-fired boiler, the summer demand savings due to the more efficient VRF system is multiplied by a coincidence factor of 0.84. However, in the winter with natural gas being eliminated and replaced by electric heating (albeit very efficient electric heating), there will be a gross energy (kW) demand increase (penalty). The gross energy demand increase (penalty) is multiplied by a winter coincidence factor of 0.8 to estimate the net demand increase (and subsequent energy cost penalty) for all property types.
EPIC users have the option to enter different summer/winter coincidence factor when such data are available for the ECM and property type.
How does EPIC enable performance comparison with peer buildings?
Source of Performance Comparison Data
The U.S. Department of Energy’s (DOE) Building Performance Database (BPD) is the nation’s largest dataset of information about the energy-related characteristics of commercial buildings, including more than 230,000 commercial building across the country. The BPD combines, cleanses, and anonymizes data collected by federal, state, and local governments, utilities, energy efficiency programs, building owners and private companies.
The BPD includes data across real estate sectors and regions and enables comparison of various physical and operational characteristics to gain a better understanding of market conditions and trends in energy performance. Building characteristics and energy consumption data can be used to compare similar buildings, i.e., same use type, and identify under-performers. The BPD can be used to analyze trends within custom defined local peer groups for specific real estate sub-markets and to benchmark a subject building’s performance against peer buildings in the same geographical area or climate zone.
The goal of the BPD is to leverage the law of large numbers to achieve performance benchmarking validity at the local level (same geographical area or climate zone), as opposed to a representative national sample as the U.S. Energy Information Administration’s Commercial Building Energy Consumption Survey (CBECS) and EPA’s ENERGY STAR Portfolio Manager (1 to 100 rating), which is based upon the CBECS, is designed to do. For this reason, the BPD is the preferred source of benchmarking data provided sufficient peer buildings are available in the same geographical area or climate zone to confidently determine the median energy use intensity (EUI) of peer buildings.
For multifamily buildings, in addition to the BPD, the U.S. DOE’s Residential Energy Consumption Survey (RECS) is used to benchmark the subject building’s EUI to peer multifamily buildings in the same geographical area, climate zone, or nationally.
Peer Group EUI
The median energy use intensity (EUI) of all peer buildings in the same geographical area or climate zone (Peer Group) is the 50th percentile EUI as determined in the U.S. DOE’s Building Performance Database (BPD) for commercial buildings and Residential Energy Consumption Survey (RECS) for multifamily buildings. In view of the variability that may exist in peer building EUI data, the EPIC Report PDF displays the peer group’s median EUI range, including a variability allowance of 10% in accordance with ASTM E3224 Building Energy Performance and Improvement Evaluation (BEPIE) standard methodology.
Benchmark Energy Performance
To determine if the subject building’s energy consumption is greater than, less than, or at parity with that of its peer group, the building’s weather normalized EUI data is used to benchmark its performance against the peer group’s median EUI range reflecting a 10% uncertainty allowance.
If the EUI of the subject building is less than that of its peer group, it generally would be viewed as more energy efficient and typically have lower operating costs, be more valuable, and be more attractive to tenants, making it more competitive in the marketplace.
If the EUI of the subject building is greater than that of its peer group, it generally would be viewed as less energy efficient and typically have higher operating costs, be less valuable, have a higher risk of obsolescence and be less attractive to tenants, making it less competitive in the marketplace.
For mixed-use buildings, whole building performance comparison with peer buildings is enabled by utilizing the peer group median EUI for each use, determining a weighted (by sq. ft.) whole building EUI benchmark and applying an HVAC adjustment factor to take common floors and ceilings into consideration. For example, in a mixed-use building with two uses: ground floor retail and upper floor office space, the “ceiling” of the retail space would be the “floor” of the office space. The net impact would be less whole building energy consumption than if each use was considered as an independent building, i.e., the whole building EUI would be less than the weighted (by sq. ft.) EUI associated with each use.
How does EPIC estimate a project’s income tax impacts?
EPIC users can enable the Tax Impacts Estimation feature in the Key Assumptions section. This feature is designed to provide users with a project’s estimated financial results on an after-tax basis. When a financing option is selected, e.g., bank loan or PACE financing, EPIC’s projections will include the estimated income tax savings from interest expense. When the Depreciation Tax Impact feature is enabled, EPIC’s projections will include estimated income tax savings from depreciation. Projections will also include an estimate of additional tax liabilities related to the project’s cost savings.
How does EPIC estimate a project’s depreciation income tax impacts?
Bonus depreciation allows federal taxpayers to deduct 100% of an eligible asset’s cost basis in the year in which the asset is placed in service. Availability of bonus depreciation for state income taxes is determined by each state’s tax code and may not be available in some states.
In cases where bonus depreciation is less than 100%, the balance of the asset’s cost basis may be depreciated using accelerated (MACRS) depreciation or straight line depreciation. If the MACRS depreciation option is chosen assets are classified as 5-year property.
For assets that qualify for the Investment Tax Credit (ITC) the cost basis used for depreciation is reduced by 50% of the ITC.
If the straight line depreciation option is chosen, the asset’s cost basis is depreciated over its useful life in equal amounts each year.
Roofing is always depreciated using the straight line method over 39 years.
How does EPIC estimate the default value for solar PV system size?
Using NREL’s PVWatts® for the subject building’s location, EPIC’s EPIC-IQ feature estimates the default value for the solar PV system size (kW DC) needed to satisfy approximately 90% of the building’s electricity consumption after accounting for the estimated energy savings impact of any energy efficiency improvements. This methodology supports the best practice “energy efficiency first” and then “right-sizing” of the solar PV system to the building’s post-energy efficiency improvements’ baseline electricity consumption. Furthermore, if energy efficiency improvements are changed EPIC-IQ will readjust the estimated solar PV system size as noted above. EPIC users have the option to enter the actual solar PV system size, where available, e.g., as determined from a solar PV system feasibility study. Such user-provided values will override EPIC’s default values and disable the EPIC-IQ feature.
View an EPIC Master Class webinar to learn more about EPIC’s “energy efficiency first” and then “right-sizing” a solar PV system.
How does EPIC estimate the default value for the Federal Investment Tax Credit?
EPIC estimates the default value for the Federal Investment Tax Credit (ITC) based on 30% of the solar PV system’s installed cost. This methodology is consistent with the Inflation Reduction Act of 2022 which extended the ITC through 2032 as a 30% credit that reduces federal income tax liability for qualified expenditures, e.g., solar PV systems. EPIC assumes the ITC will occur in the first year after system installation for purposes of its financial impact calculations. EPIC users have the option to edit the ITC value, where applicable.
To enable depreciation impact estimation, including first year bonus and remaining depreciation method, e.g., MACRS, navigate to EPIC’s Key Assumptions page and enable the Tax Impacts Estimation feature.
What does EPIC’s estimated installed cost for solar PV systems represent?
EPIC’s EPIC-IQ feature estimates installed cost for solar PV systems, derived from SRS’s solar PV project database, represents the average installed cost for such equipment based upon the cost for similar installations in peer buildings in the same geographic area. Such estimates are adjusted based on the assumption that the solar PV system will supply approximately 90% of the subject building’s electricity consumption after accounting for the estimated energy savings impact of any energy efficiency improvements. This methodology supports the best practice “efficiency first” then “right-sizing” of the solar PV system to the subject building’s post-energy efficiency improvements’ baseline electricity consumption. EPIC users have the option to enter the actual solar PV system installed cost, where available, e.g., as determined from a solar PV system feasibility study. Furthermore, such user-provided value will override EPIC’s default value and disable the EPIC-IQ feature.
What does EPIC’s Price per REC represent?
EPIC users have the option to enter the price per one megawatt hour (MWh) of solar PV energy production for eligible Renewable Energy Credit (REC) programs. Such RECs will be included in EPIC’s first year and lifetime financial impact calculations.
What does EPIC’s Net-metering Analysis Interval represent?
Under net-metering programs, excess energy produced by the subject building’s solar PV system can be exported to the electric grid and credited back on the building owner’s electricity bill. The credit is based on the utility’s “Electricity Buyback Rate”. As a result, the building owner will be billed for their “net” electricity use. As net-metering billing intervals vary by utility, e.g., monthly, quarterly, or annually, EPIC users have the option to enter the applicable net-metering interval for their project. If net-metering is not available for your project, go to EPIC’s Key Assumptions page, Energy Costs section, and enter $0.0 per kWh for the Electricity Buyback Rate.
For projects where net-metering is available, EPIC will calculate the dollar value of the excess energy exported to the grid. This value is based on the user-provided Electricity Buyback Rate per kWh and the net-metering billing interval as defined by the utility serving the subject building.
How does EPIC estimate the default value for the solar PV system’s annual energy production?
EPIC’s EPIC-IQ feature estimates the default value for the solar PV system’s annual energy production (kWh) by multiplying the monthly energy production per solar PV system kilowatt for the subject building’s location (based on NREL’s PVWatts®) by the solar PV system size (kW DC). These monthly energy production values are then summed to estimate the annual solar PV energy production (kWh).
EPIC users have the option to enter their own Energy Production by Month values based on estimates from their preferred solar PV energy production software tools, e.g., PVWatts®, HelioScope, etc. In such scenarios, these user-provided monthly production values will be summed by EPIC to calculate the solar PV system’s annual energy production (kWh). Furthermore, such user-provided values will override EPIC’s default values and disable the EPIC-IQ feature.
View an EPIC Master Class webinar to learn more about EPIC’s “energy efficiency first” and then “right-sizing” a solar PV system.
How does EPIC estimate the default value for the solar PV system’s energy production by month?
EPIC’s EPIC-IQ feature estimates the default value for the solar PV system’s monthly energy production (kWh) by multiplying the energy production per solar PV system kilowatt for the subject building’s location (based on NREL’s PVWatts®) by the solar PV system size (kW DC).
EPIC users have the option to enter their own Energy Production by Month values based on estimates from their preferred solar PV energy production software tools, e.g., PVWatts®, HelioScope, etc. In such scenarios, these user-provided monthly production values will be summed by EPIC to calculate the solar PV system’s annual energy production (kWh). Furthermore, such user-provided values will override EPIC’s default values and disable the EPIC-IQ feature.
View an EPIC Master Class webinar to learn more about EPIC’s “energy efficiency first” and then “right-sizing” a solar PV system.
How does EPIC estimate the solar PV system’s annual energy consumed?
EPIC estimates the solar PV system’s annual energy consumed based on the subject building’s monthly electricity consumption relative to the solar PV system energy produced.
EPIC’s methodology includes:
• Estimation of the subject building’s monthly electricity consumption based on weather normalized (average seasonal weather conditions) end-uses, e.g., space cooling and heating (when the subject building uses electricity for space heating)
• Comparison of the solar PV system’s estimated monthly energy production (kWh) to the subject building’s electricity consumption
• Calculation of excess monthly solar PV energy production, i.e., energy exported to the grid or onsite energy storage facility.
Furthermore, the EPIC methodology considers the net-metering analysis interval, i.e., monthly, quarterly, annually, (where net-metering is applicable) in the calculation of the solar PV system’s annual energy produced, consumed, and exported.
How does EPIC estimate the solar PV system’s annual energy exported?
EPIC estimates the solar PV system’s annual energy exported based on the subject building’s monthly electricity consumption relative to the solar PV system energy produced.
EPIC’s methodology includes:
• Estimation of the subject building’s monthly electricity consumption based on weather normalized (average seasonal weather conditions) end-uses, e.g., space cooling and heating (when the subject building uses electricity for space heating)
• Comparison of the solar PV system’s estimated monthly energy production (kWh) to the subject building’s electricity consumption
• Calculation of excess monthly solar PV energy production, i.e., energy exported to the grid or onsite energy storage facility.
Furthermore, the EPIC methodology considers the net-metering analysis interval, i.e., monthly, quarterly, annually, (where net-metering is applicable) in the calculation of the solar PV system’s annual energy produced, consumed, and exported.
How does EPIC estimate the subject building’s monthly heating and cooling consumption satisfied by the solar PV system’s energy production?
EPIC estimates the subject building’s monthly heating and cooling consumption satisfied by the solar PV system’s energy production.
EPIC’s methodology includes:
• Estimation of the subject building’s monthly electricity consumption based on weather normalized (average seasonal weather conditions) space cooling and heating end-uses, where applicable
• Comparison of the solar PV system’s estimated monthly energy production (kWh) to the subject building’s electricity consumption for space cooling and space heating, where applicable
• Calculation of monthly solar PV energy production consumed by the subject building’s electricity consumption for space cooling and space heating, where applicable.
These data are displayed on the heating and/or cooling consumption from solar chart to convey what part of monthly heating/cooling consumption is satisfied by solar PV-produced electricity and what part is satisfied by utility grid-produced electricity.
How does EPIC confirm if a building is located in a Disadvantaged Community?
Using your building’s address, EPIC conducts a search of the Climate and Economic Justice Screening Tool (CEJST) to confirm if it is in a Disadvantaged Community (DC).
CEJST is a mapping tool developed by the White House Council on Environmental Quality to geographically-define DCs. Owners of buildings in DCs may be eligible for government-funded technical and financial assistance and incentives for qualifying energy improvements.
EPIC will deliver its CEJST search result for your building:
• Confirmed: your building is in a CEJST-defined DC
• Unconfirmed: EPIC’s CEJST search is inconclusive and additional research is required to confirm whether your building is in a DC.
How does EPIC integrate energy savings from user-defined energy efficiency improvements?
EPIC integrates energy savings from user-defined energy efficiency improvements based on user-provided data, including end-use impact, first year energy savings, net installed cost, and useful life of the improvement.
This EPIC feature supports a wide range of user-defined energy efficiency improvements where the user-provided data noted above are available.
How does EPIC-assist estimate energy savings for specific improvements?
EPIC-assist feature estimates space heating and cooling savings for specific improvements based on user-provided specifications. For example, windows replacement savings are based on existing and new U-values, total square footage of replacement windows, and net installed cost.
These user-provided specifications, in addition to EPIC-provided data described below, are used by EPIC to estimate energy savings and financial impacts for specific improvements:
• Weather normalized energy consumption data based on historic heating degree day and cooling degree day data collected from the weather station nearest the property.
• Utility cost data, e.g., electricity and natural gas unit cost.
• Existing space heating and cooling equipment efficiency data.
What are typical U-Values per window types?
Below are typical U-Values (Btu/(h·ft2·°F) for a range of window types:
| Single-pane, clear | 1.10 |
| Double-pane, clear | 0.49 |
| Double-pane, argon-filled | 0.45 |
| Double-pane, Low-E | 0.35 |
| Double-pane, Low-E, argon-filled | 0.32 |
| Triple-pane, Low-E, argon-filled | 0.25 |
| Quadruple-pane, Low-E, krypton-filled | 0.17 |